I am going to assume you have ntopng installed on a pfSense and already have an ELK stack running and ready to collect data
pfSense & ntopng woes
The experience of running ntopng in pfSense is a neverending problem. Some have no problems, while most just can't get it to "stay" running properly. Personally, I had 3 different pfSense boxes for testing before deployment, and sometimes they work, sometimes they don't
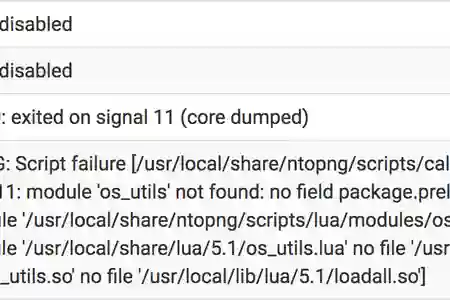
kernel pid 00000 (ntopng), uid 0: exited on signal 11 (core dumped)

If you are looking at the Lua.cpp error, stop there. It won't help, because sometimes this won't come out at all and ntopng just stops running with a "signal 11"
The quick layman fix/workaround
I am not proficient enough to debug or help solve these ntopng FreeBSD ports, and don't really want to start now. For a start, let's have ntopng restart whenever it stops running
The end goal is to have ELK collect flows/data from ntopng. In summary, ntopng can restart multiple times for all I care
What you get from this fix/workaround method:
- You can still monitor real-time (almost) bandwidth using ntopng, with that usual page not loading (as it has stopped and will be restarted by Service Watchdog). Host duration will be reset as ntopng itself restarts
- Via ELK, you can graph, filter out specific devices/IPs and its historical data/flows
Service Watchdog
Make use of pfSense's Services >> Service Watchdog to restart the ntopng service whenever it stops.
This should be pretty forward, just add the ntopng service into the Watchdog. Disable notifications if you know ntopng is going to keep restarting every 15~30mins
Add ntopng export flows option
Right, you will need to add ' -F ' option to your ntopng service
Example option to ELK stack hosted in 192.168.1.20 device would be:
-F 'es;ntopng;ntopng-%Y.%m.%d;http://192.168.1.20:9200/_bulk;' -D all
-D all is optional. This tells ntopng to dump all hostnames, which will populate SSL and HTTP hostnames in Kibana later
To edit ntopng run options, go to Diagnostics >> Edit File
under "Path to file to be edited", enter
/usr/local/etc/rc.d/ntopng.sh
Click "Load" and you will see the ntopng run options
Proceed to edit the following line:
/usr/local/bin/ntopng -d /var/db/ntopng -G /var/run/ntopng.pid -s -e -w 0 -W 3000 -i 'xn2' -i 'xn0' --dns-mode '1' --local-networks '192.168.0.0/16,172.16.0.0/12,10.0.0.0/8' &
Append your - Fconfig into that line above, it can be anywhere after /usr/local/bin/ntopng, I usually paste the command somewhere in between -W and -i
Once you have done that, your new ntopng command will be the following:
/usr/local/bin/ntopng -d /var/db/ntopng -G /var/run/ntopng.pid -s -e -w 0 -W 3000 -F 'es;ntopng;ntopng-%Y.%m.%d;http://192.168.1.20:9200/_bulk;' -D all -i 'xn2' -i 'xn0' --dns-mode '1' --local-networks '192.168.0.0/16,172.16.0.0/12,10.0.0.0/8' &
Previously I had this command listed in my Evernote which autocorrected it to " ", breaking ntopng
Proceed to click on "Save" where you first clicked on the "Load" button
Making it stick
Since ntopng will be restarting most of the time, you will need to ensure that your ntopng will always run with the new " -F " option above, and also survive a reboot of pfSense
After adding the new -F command as above, go to Diagnostics >> Command Prompt
Run the following command under "Execute Shell Command" field
chflags schg /usr/local/etc/rc.d/ntopng.sh
and click on "Execute", you will not see any result
This command locks the ntopng.sh file. It will survive reboots and also enabling/disabling via Diagnostics >> ntopng Settings GUI
chflags noschg /usr/local/etc/rc.d/ntopng.sh
Login to ntopng and check that it has the new options loaded by going to Home Icon >> Runtime Status, you should see the change and flow in Startup Line and Log Trace
Voila, ntopng is successfully sending flows to your ELK stack
Kibana Dashboard & ELK tips, hints & note
Now you have the ability to search, filter out, create custom graphs on historical data. Assuming you have already successfully collected the ntopng flows and enjoying the regret of spending even more time on making visualizations and dashboards
IN_BYTES , OUT_BYTES
Note if you are monitoring your local LAN network:
IN_BYTES = Upload
OUT_BYTES = Download
Under Kibana Index fields format, you can change IN_BYTES, OUT_BYTES, to "Bytes" to tell Kibana to show them in Bytes format
Storage
Take great care of your hard disk space, as MySQL or ELK indices can be really large if you have large flows
A 20Mbps/20Mbps Download Upload WAN, 8am - 10pm, with after hours having the least flows
will produce daily indices of sizes around 1~1.5GB. Your indices size will vary accordingly to the usage of your network
Check out ELK's documentation on how to delete indices
Minor problems not related to pfSense
ntopng's elasticsearch flow template (multiple index mapping types) is not supported in the latest ELKv6 stack. The most obvious one would be geographical and IP addresses data not being mapped properly. You can read more about this from ntopng's blog
ntopng goes Elastic: Introducing ElasticSearch 6 SupportExporting ntopng Flows to MySQL
The command will be as follows (choose only one, ElasticSearch or MySQL, not both)
-F 'mysql;192.168.1.20;ntopng;flows;mysql_username;mysql_db_password'
Other weird notes
After experimenting with exporting flows to MySQL or ELK, it seems that if you were to dump the flows elsewhere, ntopng stops restarting in pfSense. It definitely worked for me, only time will tell.


